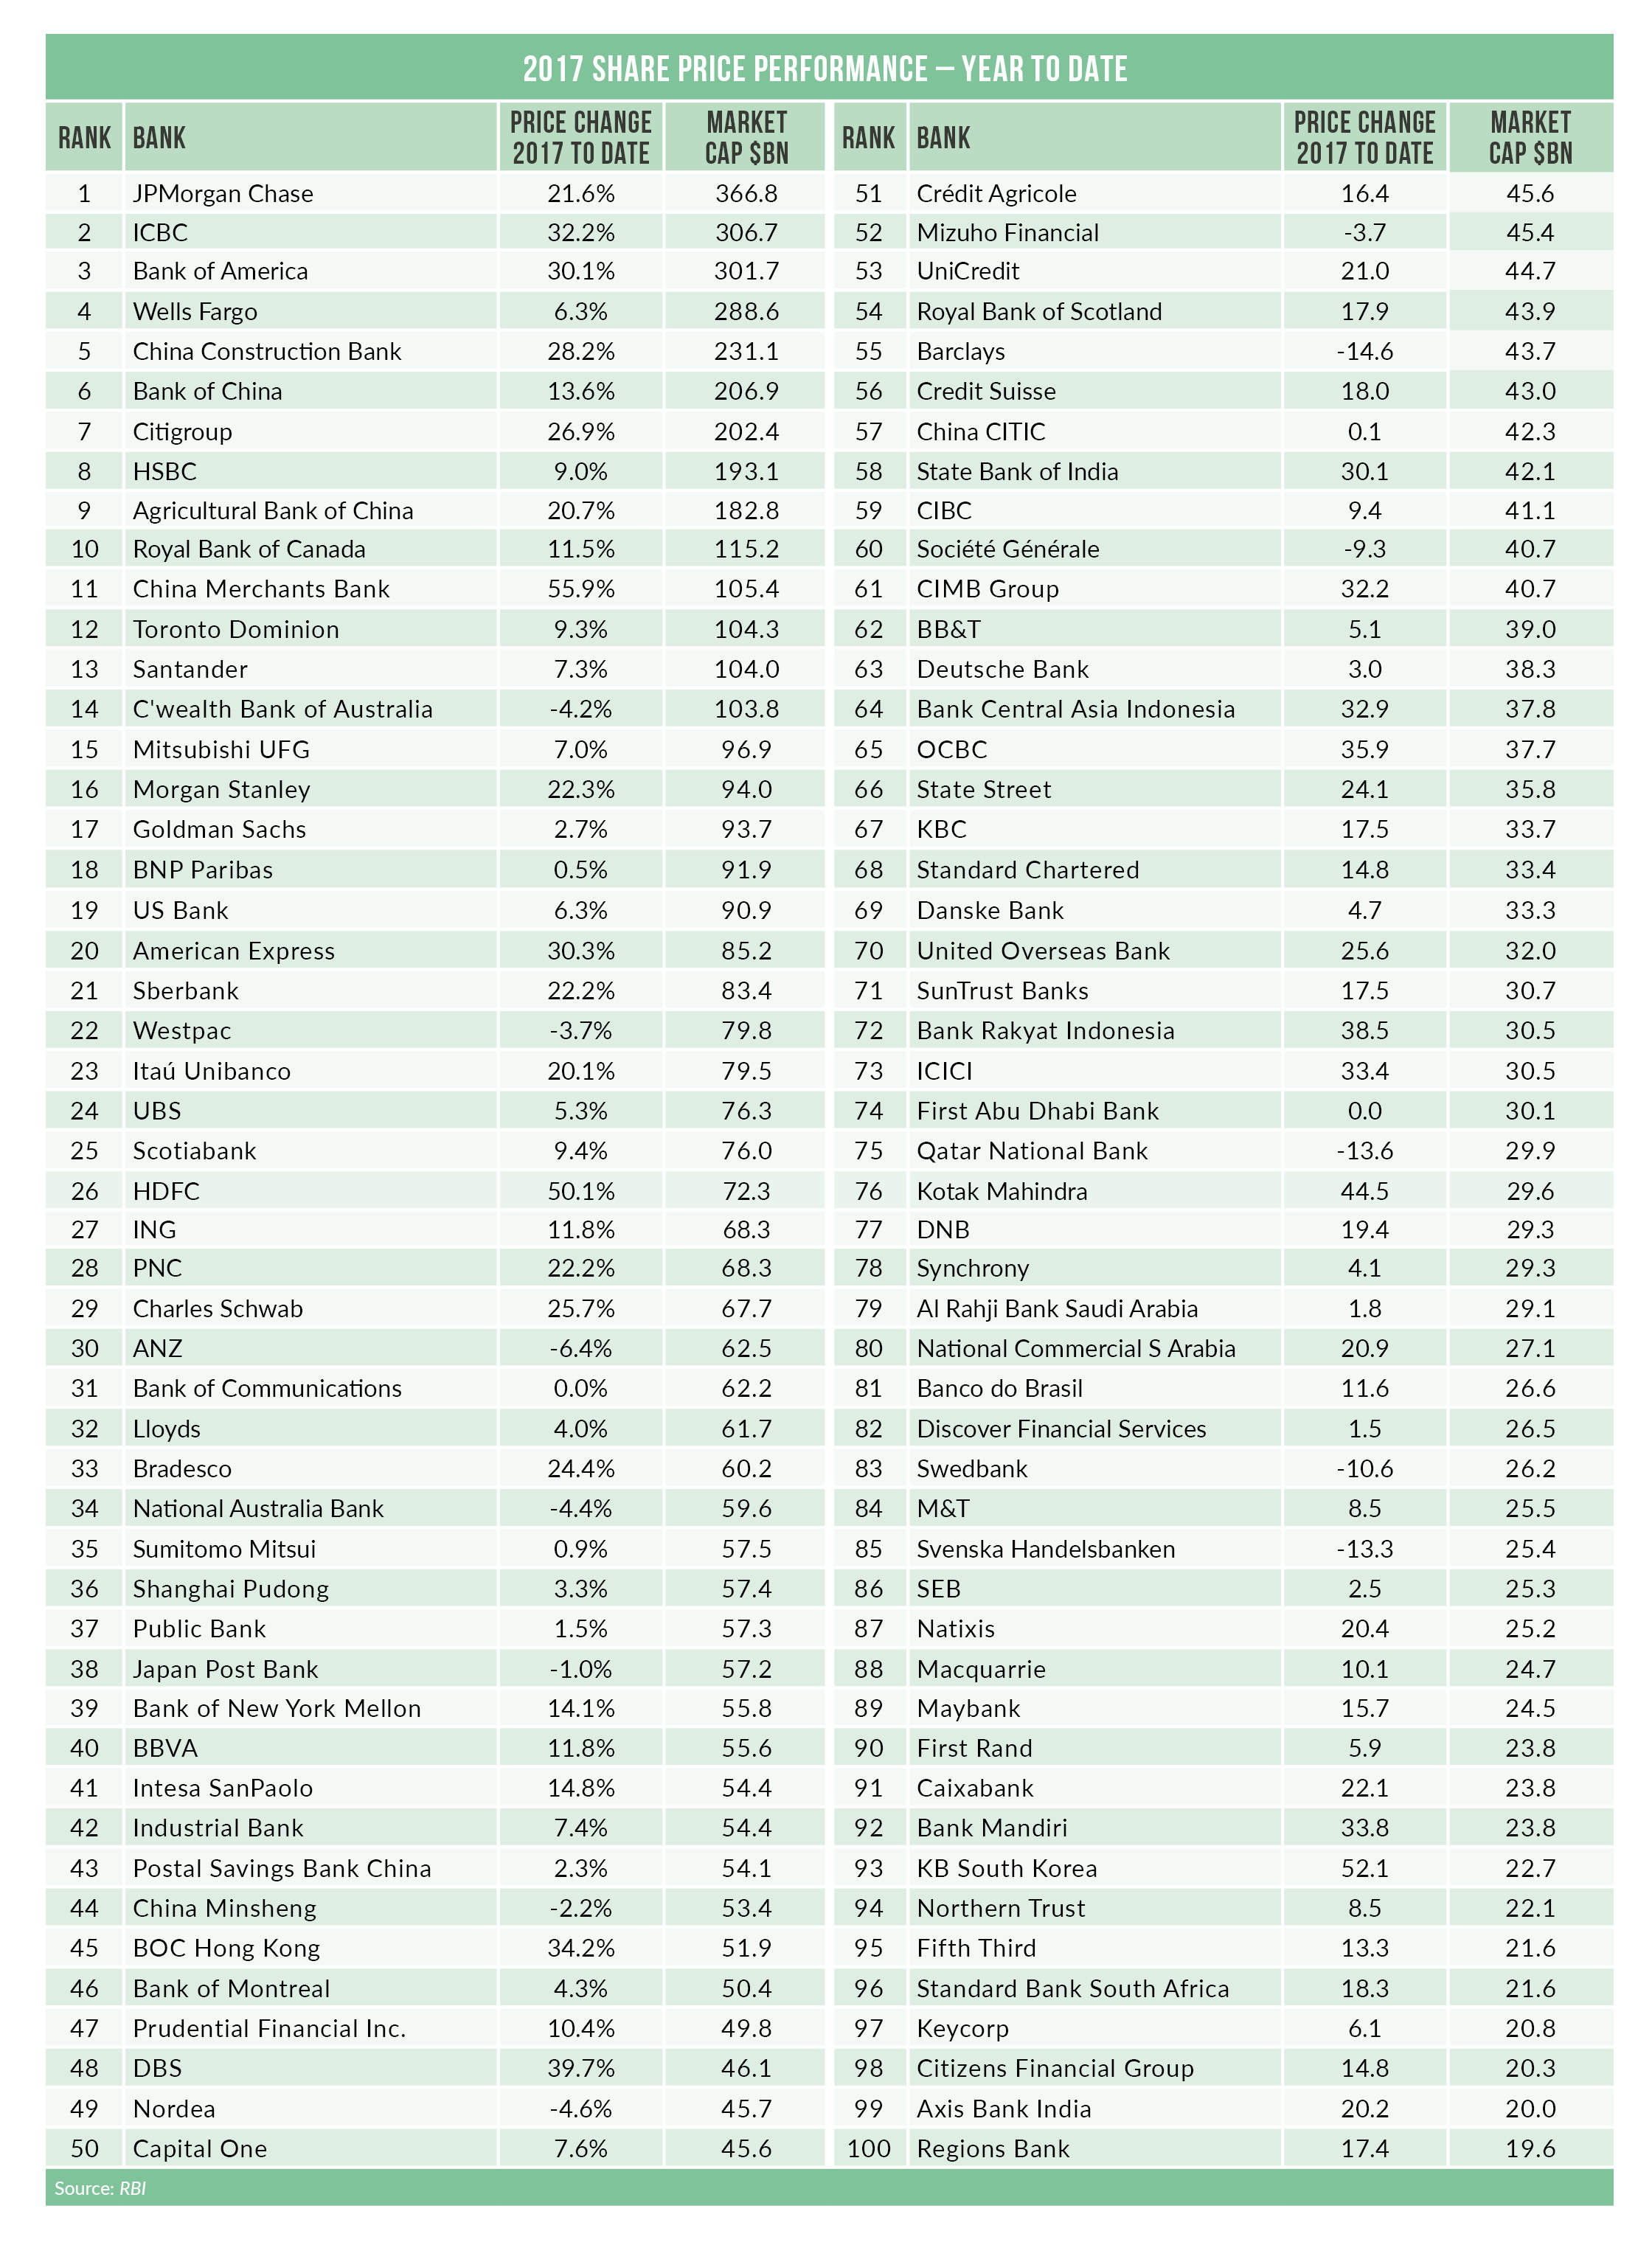
2017 has generally been a positive year for the world’s largest 100 banks by market cap with share price rises for the year to date at 87 banks. The worst performer of the world’s 100 largest banks is Barclays which has endured a year to forget. Douglas Blakey reports
Barclays’ shareholders must be a remarkably patient bunch. Just how long do they give CEO Jes Staley and chairman John McFarlane to turn things around?
Go deeper with GlobalData


Access deeper industry intelligence
Experience unmatched clarity with a single platform that combines unique data, AI, and human expertise.
For the year to 7 December Barclays’ share price is the worst performing of the world’s largest 100 banks ranked by market cap, down a whopping 14.6%.
Market sentiment to Barclays is so negative that the shares are trading at only 0.7 times tangible net asset value.
Staley has ignored calls from a number of analysts to axe the bank’s underperforming investment bank division and has instead ramped up investment in the unit and installed a new leadership team.
Will 2017 mark “the trough for Barclays” as Merrill Lynch argued in a note to clients in November?
It is way off a number of targets set by Staley and McFarlane. Barclays set itself a target of a 10% return on tangible equity.
But as leading bank analyst Ian Gordon of Investec tells RBI: “
“Investment banking revenues have been soft all year, and Q4 2017 will surely be no different. The outlook for 2018 appears (at best) uncertain.”
Gordon adds: “2018 was always billed as Barclays recovery year, in large part because substantial Non-Core losses are non-recurring and structural spend should start to trend lower. There are still some “baked in” cost efficiencies within the Investment Bank to flow through.
“Taken together, these point to a step-up in reported earnings (and potentially in dividend-paying capacity) but to be clear returns will remain well below cost of equity.”
McFarlane has been in fire fighting mode since his appointment as chairman. One of his first acts as chairman was to fire CEO Antony Jenkins in July 2015. McFarlane wanted an investment banking specialist to lead the bank – investment banking was the worst performing unit of Barclays in fiscal 2014 – so McFarlane turned to Staley with a brief to transform Barclays’ investment bank.
At the time of McFarlane’s appointment as chairman in April 2015, Barclays’ share price was around £2.60. At the time of Jenkins’ dismissal, McFarlane was reportedly telling his senior colleagues that he intended to slash costs, restructure the bank and double the share price within three years.
That goal seems as far off as ever.
McFarlane became executive chairman of Barclays following the axing of Jenkins for the period until Staley assumed the role of CEO in December of 2015.
As soon as he actually assumed his role in December 2015, Staley bought more than 2 million Barclays shares; by then the share price had dipped to £2.30
The shares now trade as of 7 December, at £1.92 following a series of setbacks during 2017 including Staley’s hamfisted efforts to unmask an internal whistleblower in the first quarter.
The second quarter of 2017 included more negative PR such as the Serious Fraud Office charging four former Barclays’ executives with offences after a five-year investigation into Barclays’ £11.8bn emergency fundraising in 2008.
Other distractions include charges from the US Department of Justice relating to alleged mis-selling of mortgage bonds a decade ago.
Says Gordon: “On conduct, there is a general assumption that Barclays will ultimately settle with the US DOJ, but terms and timescales are uncertain. This is probably Barclays largest single unprovided item.”
Looking ahead, Gordon describes performance within the bank’s UK retail unit as “broadly stable if not spectacular.”
Further significant restructuring costs and cost-saving within its UK branch network can safely be forecast, albeit on a more modest scale than witnessed in the past two years. Having sold off its African unit and exited European retail banking, headcount at Barclays has reduced by more than 50,000 during Staley’s tenure.
As reported by RBI in November, Barclays will end 2017 with a UK branch network of 1,237 outlets, down by a net 72 during the year.
By contrast, more aggressive branch rightsizing has been taking place at Lloyds (down by 173 branches to 967 outlets; rival brands NatWest ends 2017 with 655 down by a net 403 during 2017 while HSBC has closed 123 units to end the year with 625 branches.
Concludes Gordon: “Capital was largely fixed in 2017 (and receives a further small lagging top-up from the Barclays Africa sale), and some costs/non-core losses drop out in 2018, but the revenue outlook still appears challenging. The investment case hangs on the fact that Barclays appears “cheap” on 0.7x 2017e tNAV and has the capacity to become “less cheap” over time.”
Gordon set a target price for Barclays of £2.35; realistic but hardly exciting and no more than getting back to the share price on Staley’s first day in his role.
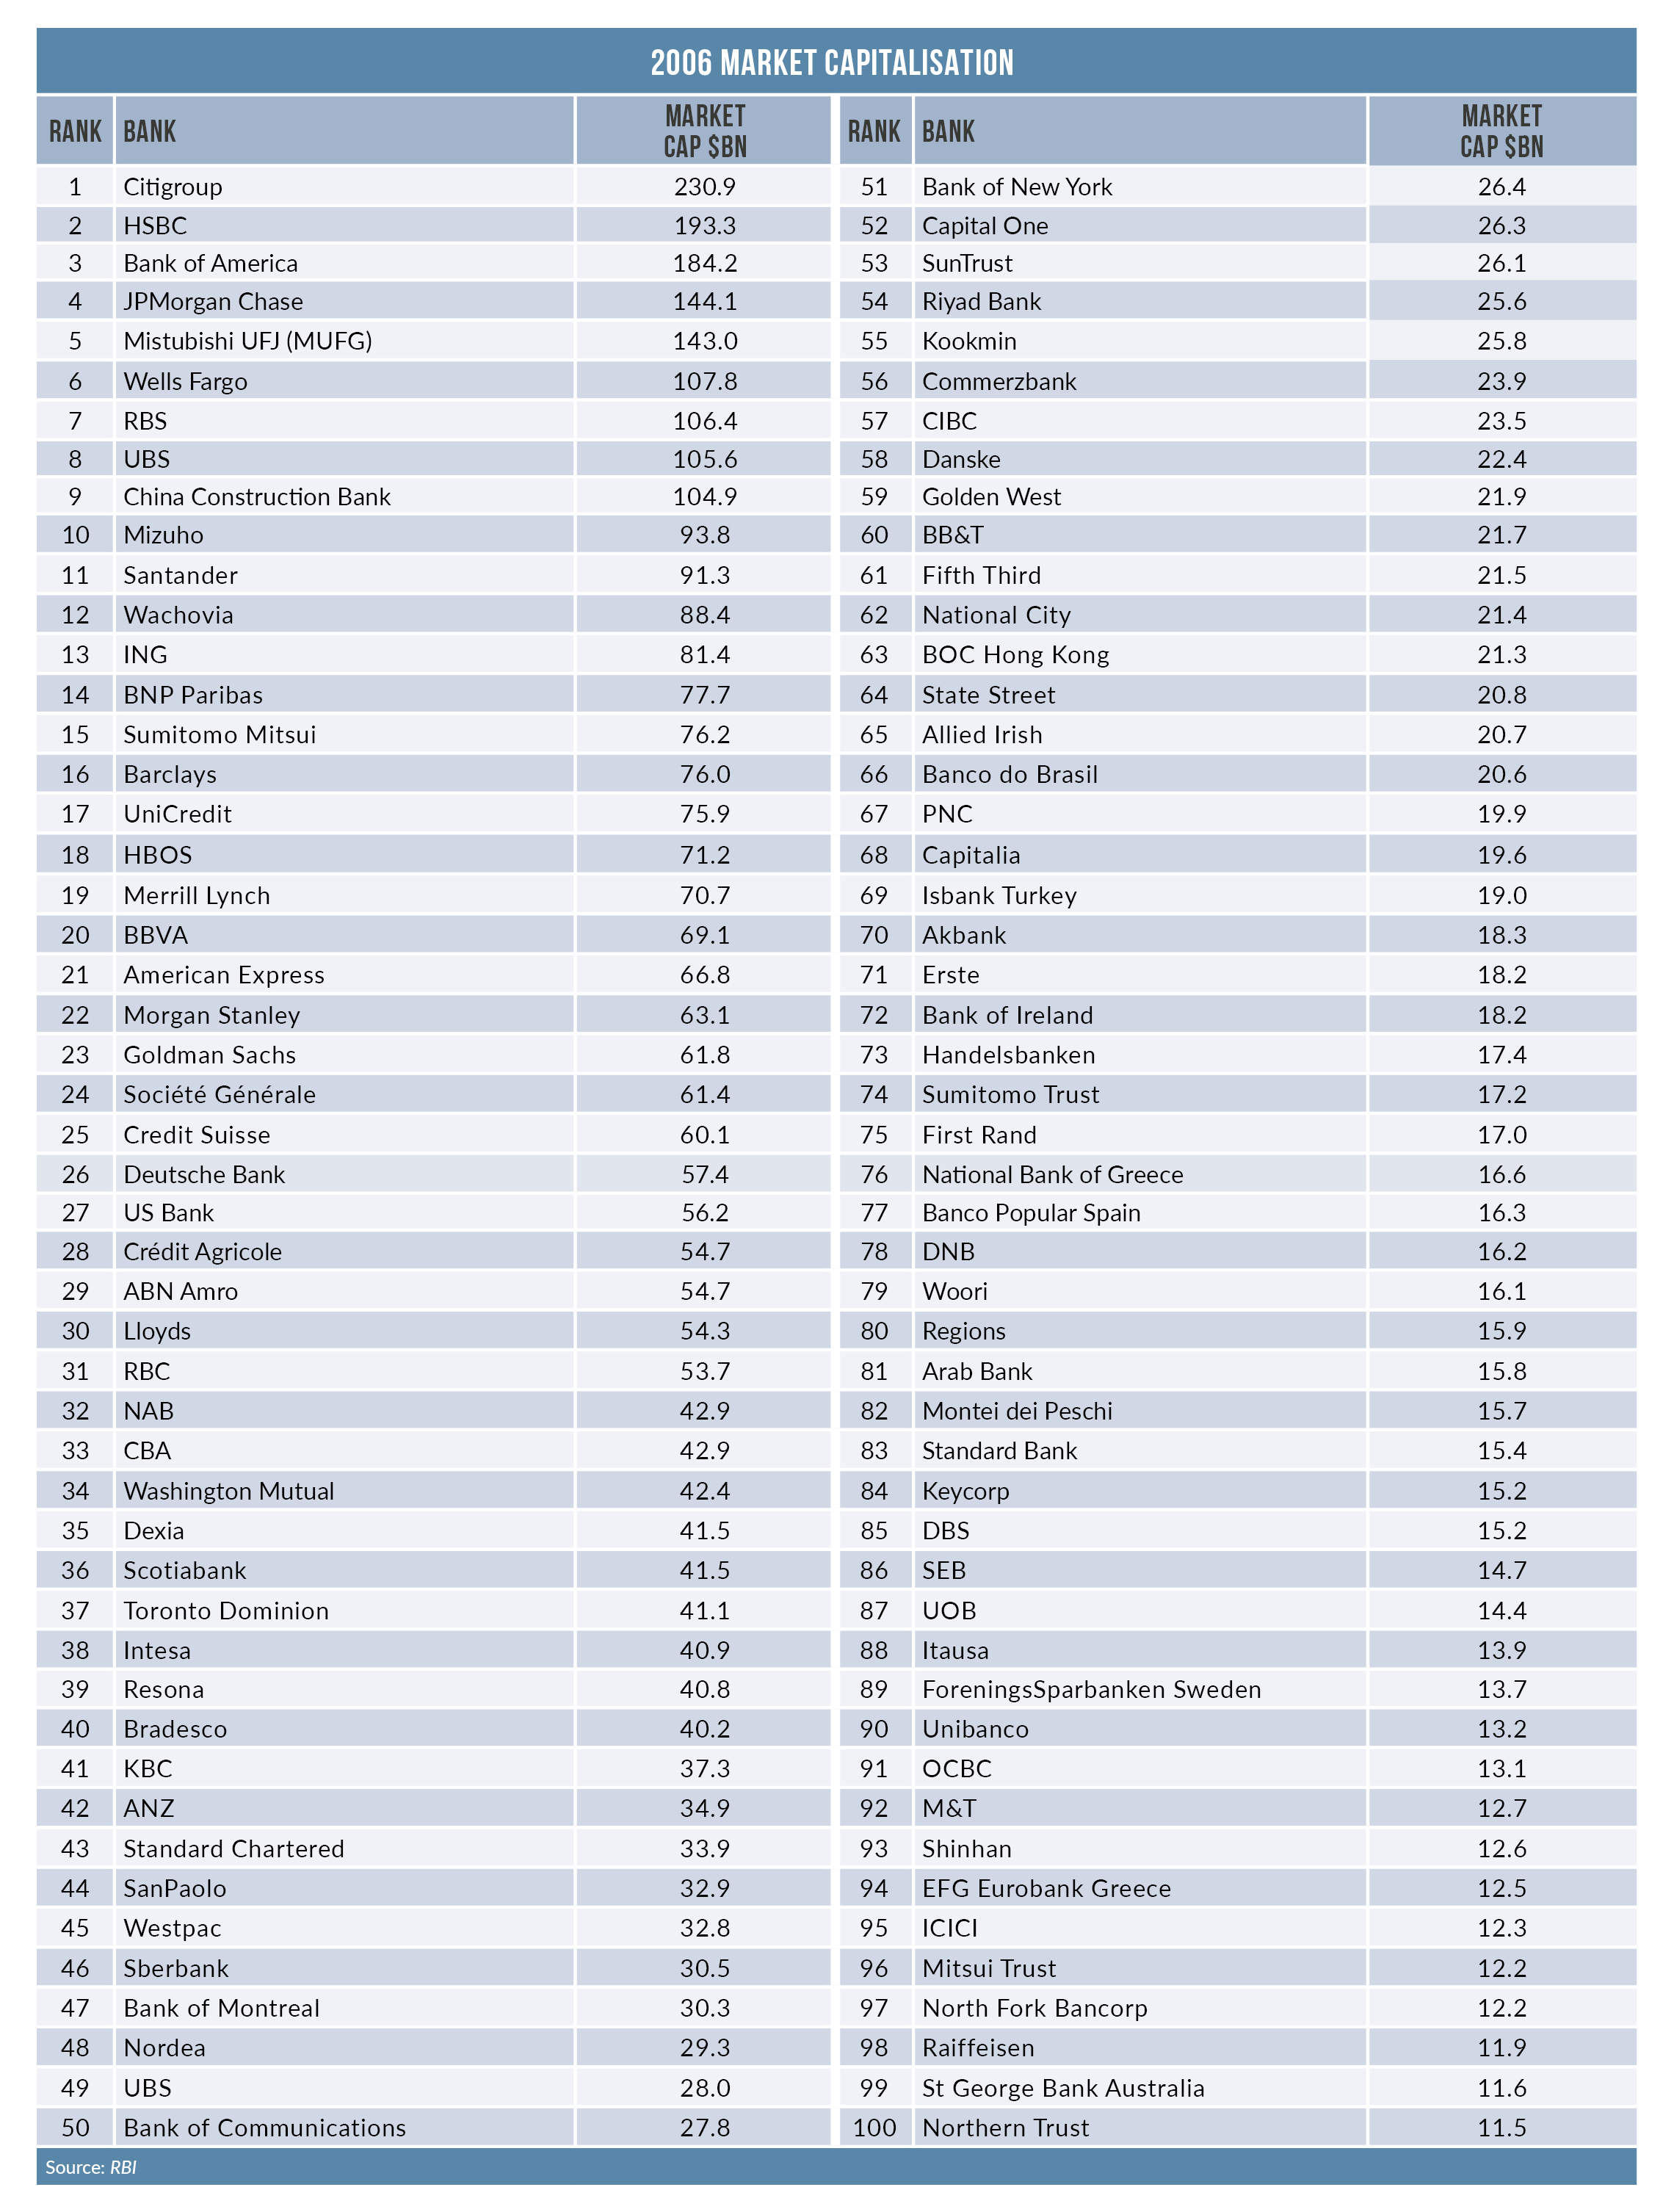
Pre-crisis ranking v today
At the end of 2006, Citi ranked top as measured by market cap (see table).
Despite a strong performance for the year to date with its share price more than 25%, its market cap has not yet returned to its pre-crisis level. At HSBC, its market cap has only now recovered to its pre-crisis level of around $193bn. In the intervening years, HSBC has slipped from 2nd to rank eighth by market cap.
By contrast, market caps have more than doubled at JPMorgan Chase and Wells Fargo, now ranking 1st and fourth respectively.
The other obvious change since the end of 2006 is the presence of China’s four largest banks in the top 10; pre-crisis, only China Construction Bank featured in the top 10.
Other notable risers include the major lenders in Canada and Australia.
Royal Bank of Canada makes the top 10 now for the first time in its history, up from 31st pre-crisis; Toronto Dominion features at number 12 (37th) with Scotiabank 24th (36th).
In Australia, three of the big four banks have risen with CBA now 14th (from 33rd pre-crisis) with Westpac now 22nd (45) and ANZ 30th (42).
Also in Asia-Pac, DBS has enjoyed a strong 2017 with its share price ahead by almost 40%; it now ranks in the top 50 with a market cap three times its pre-crisis level.
Notable losers include Royal Bank of Scotland (RBS) and Barclays. RBS has slipped from 7th pre-crisis to 54th today while Barclays is now 55th (18th). At UniCredit, much work remains to be done but a stronger performance in 2017 has resulted in a 21% rise in its share price for the year to date.
By market cap, UniCredit now ranks 53rd against 17th pre-crisis.
ING is another notable European lender with its market cap still to recover pre-crisis levels and is down from 13th to 27th.
Similar comments apply to Germany’s Deutsche Bank (62nd from 26th) and Commerzbank though the latter is firmly in recovery mode. Commerzbank does not now rank in the top 100 banks by market cap but its share price has risen by 55% for the year to date and with a market cap of $18bn should return to the top 100 during 2018.
It is a similar story at Erste; its share price has risen by 26% for the year to date and its market cap of $18bn is back to its pre-crisis mark.
By contrast, market cap at Standard Chartered has now returned to its pre-crisis level albeit it now ranks 68th from 43rd.
Bank of America roller-coaster
There was a time, not so long ago (circa 2009) when Bank of America’s share price plummeted below the significant $5 mark and it paid the price for some unfortunate acquisitions (Countrywide) and expensive buys such as Merrill.
Throw in mega financial, regulatory, and legal problems and it has been a long way back. Bank of America’s share price now hovers around the $30 mark and it ranks second by market cap.
Its share price is up by one-third for the year to date and yet its price to book valuation (around 1.1) remains below that of a number of its peers.
BofA has done a lot of the heavy lifting, with regulatory settlements and branch rightsizing – more than one-quarter of its stores have closed post-crisis.
Accordingly, BofA has been able to return cash to shareholders through dividends and earnings growth; back at Barclays by contrast, dividends have been nominal.
Ian Gordon forecasts Barclays’ dividends of 8p in 2018 and 11p in 2019 and a prospective dividend yield of 5.6%.
If that modest goal is not achieved, shareholders’ patience really will be tested.