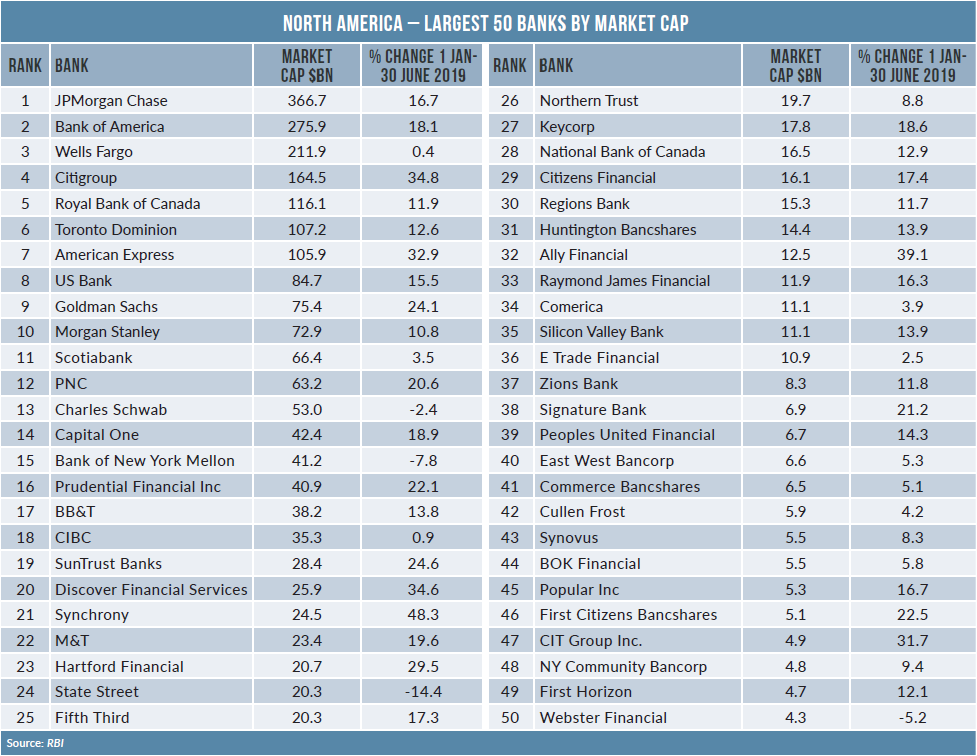
Share prices are up at 46 of the 50 largest North American banks by market cap for the six months to end June, but as the second-quarter reporting season kicks off, the question is: have bank profits peaked due to margin pressure? Douglas Blakey reports
So far so good for US banks in the first half, with share prices up and resilient second-quarter results.
Go deeper with GlobalData


Access deeper industry intelligence
Experience unmatched clarity with a single platform that combines unique data, AI, and human expertise.
Of the largest 50 North American banks by market cap, only Charles Schwab, Bank of New York Mellon, State Street and Webster Bank post a fall in share price.
Across the border, all five major Canadian banks are also posting first-half gains in their share prices.
Citi is among the strongest US performers: for the six-month period to end June, its share price is up by 34% (see table). Citi also kicked off the reporting season with a second-quarter net profit of $4.8bn, up almost 7% year on year.
Citi’s earnings beat analyst forecasts – a theme that was to be repeated at the other major US lenders. The rise in Citi’s net income is driven by higher revenues and a reduction in expenses; specifically, there is a 2% fall in expenses, the 11th consecutive quarter of positive operating leverage. This helps to reduce the Citi cost-income ratio in the second quarter to 56.7% from 57.9% in the year-ago quarter.
Less positive is the reduction in Citi’s net interest margin, which falls five basis points from the first quarter to 2.67%.
The modest fall in Citi’s net interest margin is repeated at the other major US banks in the second quarter. One day after Citi’s results, along comes JP Morgan Chase, yet again beating analyst forecasts. Chase reports net income of $9.65bn for the three months to end June, up 16% year on year.
The rise in net income is driven by strong retail banking metrics; in particular, mortgage, auto originations and deposits all show strong growth.
And in a near repeat of Citi’s key metrics, Chase’s cost income ratio and net interest margin are also down. Its cost-income ratio of 57% is down from 58% a year ago, while its net interest margin drops by eight basis points to 2.49%.
To put the figures in context, one interest-rate cut of 25 basis points in the second half would reduce Chase’s revenue by around $60m – in other words, a modest amount compared to quarterly net interest income of about $15bn.
Margin pressures
The release of Chase’s second-quarter results scored a dead heat with Wells Fargo. Wells’s second-quarter earnings also beat analyst forecasts, boosted by successful cost cutting and a rise in non-interest income.
Net income of $6.2bn for the quarter to end June is up 20% from $5.2bn for the year-ago quarter; non-interest income rises by 5.3% over the same period.
Second quarter non-interest income includes higher trust and investment fees, service charges on deposit accounts, and higher card fees. On the other hand, net interest income is down by 3.5% to $12.1bn. Margin pressure at Wells Fargo results in a nine-basis-point drop in net interest margin for the quarter to 2.82%.
Against the challenging backdrop of the fallout of its mis-selling scandal, however, there are a number of positive metrics.
Positive retail metrics
Notably, Wells Fargo primary consumer current account customers increase by 1.3%, up from 23.9 million a year ago to 24.3 million.
In addition, branch customer experience surveys completed during the second quarter 2019 of reflect higher scores than the previous quarter. In particular, the “Customer Loyalty” and “Overall Satisfaction with Most Recent Visit” scores reach their highest levels for over three years.
But it is the prospect of interest rate cuts that is spooking analysts covering Wells Fargo. Its net interest income falls by 4% in the second quarter. The bank forecasts a gain in net interest income of around 5% this year, although that estimate looks optimistic – in particular if the Fed cuts rates by more than 25 basis points in the second half of the year.
Bank of America’s second-quarter results continue the theme: beating forecasts but with evidence of margin pressure. Net income for the quarter to end June rises by 8% year on year to $7.3bn. On the other hand, the Bank of America net interest margin is down seven basis points to 2.44%.
But it is the bank’s strong retail banking metrics that deserve to grab the headlines. The consumer banking division posts net income up by 13% to $3.3bn. Retail loans are up by 6% to $296bn. At the same time, deposits rise by 3% to $3.3bn, while consumer investment assets are up 15% to $220bn. Other notable highlights include a two percentage-point drop in the bank’s cost-income ratio to 45%.
The bank’s wealth and investment banking unit also posts a strong quarter, with net income rising by 11% to $1.1bn. The unit also records a record pre-tax margin of 29%, while loans are up 3% and deposits up 7%. Moreover, for the year to date, net new Merrill Lynch households soar by 45%.
Branch highlights
Another recurring theme is the predictable evidence of strong digital gains and overall branch closures.
For all the talk of new branches opening in new markets, Chase continues to close branches overall: it ends the second quarter with 4,970 branches, down by a net 121 outlets from a year ago. The Chase branch network peaked at 5,697 in 2013.
Meantime, Bank of America ends the second quarter with 4,349 branches, representing a net reduction of 62 outlets in the past 12 months.
Bank of America’s branch network has reduced each year since peaking at 6,238 in 2009. In the past 10 years, Bank of America has axed almost 1,900 branches, approaching a third of its network.
Wells Fargo’s branch rightsizing also continues. It now has 5,442 branches, compared with 5,751 at the end of the second quarter last year. Despite closing over 300 branches since the start of 2018, Wells Fargo remains the largest US bank by branch numbers. The bank’s network peaked at 6,795 outlets in 2009, following its acquisition of the failed Wachovia.
Citi ends the second quarter with 688 branches in North America, down by only five from a year ago. Its US branch network peaked at 1,079 in 2008.
Among a number of digital banking highlights, Chase’s active digital banking customers rise by 6.5% from 47.9 million a year ago to 51 million. Meantime, active Chase mobile banking customers increase by 12% to 35.4 million.
By contrast, Bank of America’s active mobile banking users grow by 10% to 27.8 million. At Wells Fargo, the corresponding increase is 8% to 23.7 million, with Citi up by 12% to 11.4 million.